
This document further explains how we arrived at the numbers presented in IBC's preliminary analysis of the Iraq War Logs. We also include here some of the more detailed of those findings, as they now stand.
This is a supporting article to our analyses of the number of previously unreported Iraqi deaths, the wider context and the previously unknown details concerning Iraqi casualties to be found within the logs released by WikiLeaks.
Iraq War Logs: Technical appendix to IBC analysis
First published 25 Oct 2010
Rationale and Method
Several factors influenced our analytic approach. We could not analyse all of the Iraq War Logs one by one because we had only a few weeks to prepare our report using very limited resources. Yet we wanted to understand the logs as a whole. In particular, we wanted to get a handle on what these logs will add to the information already in the public domain about deaths in the Iraq war. We were especially interested in civilian deaths since these are what IBC has been recording since the beginning of the war. Given the very limited time, we decided that the best way forward was to draw a random sample of all of the logs and match these up against the IBC database. The question then became how to draw this sample.
We had good reasons to expect that there would be a strong relationship between sizes of events, measured by the number of deaths, and the rate at which these would match against the IBC data, with deaths in larger events matching more frequently than smaller ones.1 We wanted to draw data that would illuminate this relationship with a reasonable degree of statistical reliability. This goal required the sample to adequately cover the full range of different event sizes. If, to the contrary, we had drawn a simple random sample, i.e., we had given every log an equal probability of selection, then our sample would have contained a very large number of small events and very small samples of large events. In this case, our matching-rate estimates for larger events would have been extremely imprecise. To overcome this problem we drew a stratified sample that guaranteed good coverage of a full range of size classifications.
It was impossible to select good samples for every possible event size (1,2,3…). So we combined the events into size ranges that are narrow for the smaller, more common, events and wider for the bigger ones. These ranges were 1, 2-3, 4-9, 10-19 and 20+ (the latter being exhaustively analysed).
A further consideration is that estimate precision improves at a decreasing rate as sample size grows. So, for example, the added precision from sampling an additional 25 logs will be more starting from a base where one has sampled only 25 logs than it will be starting from a base of 100 sampled logs. Doubling our sample size of events with one civilian killed from 100 (our actual size) to 200 would not have been possible in the time available, and would have given only a small boost to precision.
We also wanted to completely understand the large events in the logs, where the determination of the cut-off for “large” would depend mainly on the limited time available to carry out the analysis. We started processing large events and soon realised that there would only be sufficient time to process all the events with twenty of more deaths and still process a good sample of events below this size. This is how we settled on the 20+ cutoff for full analysis.
We judged that there would be enough time to randomly sample about 500 logs after the full census of the large events was complete. Following the principles discussed above we wanted most of these sampled logs to be in the civilians category. This ensured that we sampled each size range reasonably well and did not sample any one size range beyond the point of diminishing returns. We settled on the sample sizes each category, given in the first three tables below, whose confidence intervals, assuming the worse-case spread (at a matching rate of 50%) were sufficient for this preliminary work.
Logs were each given a unique identifier, and the list then shuffled randomly. Each sample category was derived by filtering the shuffled list according to the selected size ranges, and drawing the required number of logs from the top of this shuffled list.
The next step was to carefully match each of the selected logs to the IBC database. The details recorded in the logs were examined by an experienced member of the IBC team. Date and location were used to initially identify potential matching IBC entries. The best match from these incidents, based on numbers killed, and type of weapons used, helped to identify matching incidents. If no match could be found the search was extended to the day before or after the date given in the log, as discrepancies could exist between the two sources on any given variable, including the exact date. Provinces can sometimes be discrepant as well, particularly near the boundaries of two or more provinces, so neighbouring provinces were searched as well when no match could be found. Some difficult cases required reexamination of the original source reports used by IBC.
There are two distinct types of matches determined for each log. The first is whether the deaths were included in IBC. The second was whether the details of the specific incident were recorded as a discrete entry in IBC. Many thousands of deaths in the IBC database are not recorded at the level of detail of a specific violent event or incident, but rather as an aggregated total of multiple events. One such example is noted in our accompanying 'details' article, where IBC has only one entry for 35 bodies found around Baghdad over the course of a day.2 The logs also record 35 bodies found on that day in Baghdad but record each specific incident independently, and include many other details of the deaths. In such a case the deaths are considered matched in the IBC database while the incidents are not. This explains why the matching rates are different in the three deaths tables, and three incident tables below, with deaths generally having a considerably higher matching rate than incidents.
Our matching criteria were fairly strict. For example, if no matching incident was found within a few days of the date recorded in the log it was determined to have no match. This strictness could overstate the number which failed to match in cases where the dates recorded in the two sources differed by more than a couple of days.
The following three tables summarise our estimates of the number of deaths that will be added to public knowledge in the different categories of the Iraq War Logs once all of the new records are processed by IBC researchers and integrated into IBC's database. The confidence intervals reflect only sampling errors, and do not reflect non-sampling errors, such as undiscovered coding errors in the logs or IBC.
Deaths in the 'Civilian' category
| 1 | 2-3 | 4-9 | 10-19 | 20+ | All | |
|---|---|---|---|---|---|---|
| Total deaths | 24,721 | 14,665 | 11,069 | 5,711 | 9,915 | 66,081 |
| Sampled logs | 100 | 100 | 50 | 50 | 239 | 539 |
| Total deaths in sampled logs | 100 | 222 | 258 | 682 | 9,915 | 11,177 |
| Percent matched | 73.5% | 72.0% | 87.0% | 95.0% | 99.4% | 81.2% |
| Estimated matching variance | 0.17 | 0.17 | 0.090 | 0.043 | NA | 0.00016 |
| Weights | 0.73 | 0.19 | 0.062 | 0.013 | NA | NA |
| Estimated new deaths (95% CI) | 6,551 (4,508-8,594) | 4,106 (2,879-5,333) | 1,439 (491-2,387) | 286 (36-605) | 56 | 12,438 (10,999-13,877) |
In some of the categories for which the estimates of new deaths or incidents are very small the lower limits for the confidence intervals dip slightly below zero. This is because the formula for calculating confidence intervals does not automatically account for the fact that the number of deaths to be added to the IBC database from the logs cannot be a negative number. In these cases we replaced the negative lower limit of deaths to be added to the IBC database with the number of actual (not estimated) new deaths we found in the sampled logs within that category. Clearly the final number of new deaths to add to IBC cannot be lower than these.
Deaths in the 'Host Nation' category
| 1 | 2-3 | 4-9 | 10-19 | 20+ | All | |
|---|---|---|---|---|---|---|
| Total deaths | 6,392 | 4,193 | 3,188 | 1,050 | 373 | 15,196 |
| Sampled logs | 25 | 25 | 25 | 25 | 14 | 114 |
| Total deaths in sampled logs | 25 | 56 | 127 | 308 | 373 | 889 |
| Percent matched or not compatible* | 80% | 70.0% | 96% | 96% | 100% | 82.2% |
| Estimated matching (plus non-compatible) variance | 0.17 | 0.19 | 0.040 | 0.019 | NA | 0.00062 |
| Weights | 0.71 | 0.21 | 0.070 | 0.0094 | NA | NA |
| Estimated new deaths (95% CI) | 1,278 (213-2,344) | 1,258 (517-1,999) | 128 (4-388) | 42 (15-101) | 0 | 2,706 (1,946-3,465) |
* There is considerable overlap between IBC and the Host Nation category, mainly because IBC includes ordinary (non-paramilitary) police. Most other Host Nation deaths fall outside the IBC definition of civilians so IBC does not record them (see section 3.3 of IBC Methods on ‘Inclusion and exclusions’). This means that Host Nation deaths can fail to match IBC for two reasons: either IBC is simply unaware of those deaths or they are deaths that are not compatible with IBC’s inclusion criteria. For the purpose of estimating the number of new deaths to be added to IBC, deaths of the latter type are effectively equivalent to matched deaths, since neither matched deaths nor non-compatible (e.g. combatant) deaths will add new deaths to IBC. As such, these are treated as equivalent in the table above.
Deaths in the 'Enemy' category
| 1 | 2-3 | 4-9 | 10-19 | 20+ | All | |
|---|---|---|---|---|---|---|
| Total deaths | 5,457 | 5,968 | 5,486 | 2,676 | 4,397 | 23,984 |
| Sampled logs | 25 | 25 | 25 | 25 | 107 | 207 |
| Total deaths in sampled logs | 25 | 58 | 133 | 337 | 4,397 | 4,950 |
| Percent matched / Classification disputed | 16% | 12% | 14% | 9% | 20% | 14% |
| Estimated matching variance | 0.098 | 0.089 | 0.053 | 0.076 | NA | 0.00016 |
| Weights | 0.59 | 0.28 | 0.11 | 0.022 | NA | NA |
| Estimated death classifications disputed(95% CI) | 873 (175-1,572) | 716 (7-1,444) | 768 (255-1,281) | 241 (31-542) | 887 | 3,485 (2,992-3,978) |
| Estimated death classifications not disputed (95% CI) | 4,584 (3,885-5,282) | 5,252 (4,524-5,979) | 4,718 (4,205-5,231) | 2,435 (2,134-2,736) | 3,510 | 20,499 (20,006-20,992) |
When IBC is unsure of whether deaths are of civilians or combatants it publishes an upper and lower range of figures to reflect this uncertainty. So, for example, if six people of ambiguous status are killed in an incident then that incident will be coded as zero to six civilian deaths. The estimate of 3,485 disputed deaths is based on the upper range of IBC figures which means that IBC concedes that some of these victims may have been combatants. If we instead use IBC’s lower range the estimate for disputed deaths is 3,148 (CI: 2,551-3,745). Since these numbers are fairly close, the discussion in the main text uses only the upper range, mainly to avoid the added complication of having to speak in terms of multiple ranges.
Deaths in Iraq War Logs and IBC compared
The number of 79,187 deaths in the Iraq War Logs is our calculation of the number of deaths contained in the logs which meet the same inclusion/exclusion criteria as IBC’s civilian deaths database. This allows us to look at comparable deaths in the two sources and determine what portion of each dataset is missing from the other. To derive this IBC-comparable deaths total we include the entirety of the ‘Civilian’ category of the logs (66,081). We then add our central estimate of the number of ‘Host Nation’ deaths that fall within IBC’s inclusion criteria (e.g., non-paramilitary Iraqi police) based on the results found in the samples described above. This figure comes to 9,621 (8,558-10,684) out of 15,196 total ‘Host Nation’ deaths. We then also add our central estimate of the number of disputed ‘Enemy’ deaths, as we determined these to be in IBC as civilians. This figure is 3,485 (2,992-3,978) as shown in the table in the previous section.
Combining these three figures results in 79,187 (78,191-80,183) deaths in the logs that can be directly compared to IBC. The remaining deaths in the logs (roughly 30,000) are of combatants (e.g., Iraqi Army, insurgents) which IBC does not include in its database, and must therefore be excluded from this comparison to reveal the number of IBC-recorded deaths that are missing from the logs. (These combatant deaths are discussed in the ‘Total deaths’ section in our main 'numbers' article and below).3
The comparable IBC figure is simply the IBC total for the period of 1 January 2004 through 31 December 2009 (92,092), minus the months of May 2004 (621) and March 2009 (416) since these months are missing from the logs. This leaves a comparable IBC total of 91,055.
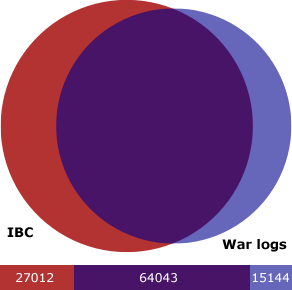
We have previously estimated that 15,144 (13,525-16,762) of the comparable log deaths are missing from IBC, thus when we subtract this number from 79,187 the remaining number of comparable log deaths that actually match to IBC is reduced to 64,043. We can then subtract 64,043 from 91,055 and see that the remaining number of IBC-recorded deaths left unaccounted for in the logs would be 27,012.
Here and in the main text we use central estimates only, for the sake of simplicity. The range of error inherent in the parts of these calculations that rely on estimated figures are shown here using 95% confidence intervals.
Total deaths 2003-2010
In three cases, where labelled, the table in the main text of this section uses central estimates derived from our sample. The only one of these not to be discussed elsewhere is “Iraq War Logs ‘Host Nation’ combatant - central estimate”. The 95% confidence interval for this estimate of 5,575 is 4,512-6,638.
Here is a list of, and links for, all sources used in this section for combatant deaths for the missing sections of the logs. These numbers were officially released figures from either the US Department of Defence or the Iraqi government:
- Insurgents killed June-December 2003
- Insurgents & Iraqi soldiers killed
January-September 2010
Jan: 20 soldiers, 54 insurgents
Feb: 45 soldiers, 52 insurgents
Mar: 101 soldiers, 57 insurgents
Apr: 15 soldiers, 48 insurgents
May: 17 soldiers, 55 insurgents
Jun: 30 soldiers, 44 insurgents (subscription required, NINA 01 July 2010)
Jul: 50 soldiers, 100 insurgents
Aug: 54 soldiers, 98 insurgents
Sep: 33 soldiers, 78 insurgents
-
Insurgents killed May 2004
-
Insurgents & Iraqi soldiers killed March
2009
- US & Coalition military killed
Analysis at the incident level
The following three tables summarise our estimates of the number of newly detailed incidents that will be added to the IBC database in the different categories of the Iraq War Logs once all of the new records are processed.
Incident details in the 'Civilian' category
| 1 | 2-3 | 4-9 | 10-19 | 20+ | All | |
|---|---|---|---|---|---|---|
| Total logs / incidents | 24,721 | 6,514 | 2,096 | 439 | 239 | 34,009 |
| Sampled logs / incidents | 100 | 100 | 50 | 50 | 239 | 539 |
| Percent matched | 28.5% | 36.0% | 67.0% | 91.0% | 98.3% | 32.4% |
| Estimated matching variance | 0.18 | 0.20 | 0.20 | 0.078 | NA | 0.00019 |
| Weights | 0.73 | 0.19 | 0.062 | 0.013 | NA | NA |
| Estimated new specified incidents | 17,676 (15,579-19,772) | 4,169 (3,580-4,758) | 692 (424-960) | 40 (6-73) | 4 | 22,979 (22,056-23,903) |
20+: There were 239 logs that each recorded 20 or more deaths, for a total of 9,915 deaths. There were a total of 6 logs that were not matched to the IBC database. 4 of these cases were discounted in our analysis for various reasons:
- (IRQ20061229n126) A mortar attack is recorded incorrectly in the Iraq War Logs as having 22 deaths and 1 injury while the accompanying text makes clear that it actually had 1 death and 22 injuries, i.e., deaths and injuries were reversed. The transposition of deaths and injury in this way has been observed in other logs.
- (IRQ20070109n105) A helicopter accident involving deaths of foreign security contractors which are not not within the inclusion criteria of the IBC database.
- (IRQ20080718n56) A report based on “Military intel” refers to an unconfirmed find of 250 bodies in a mass grave in Baghdad. There have been many such finds of mass graves of both pre- and post-war victims during the war but this report provides no indication of whether the alleged find was of pre- or post-war deaths. Moreover, a search of media sources for the period revealed no evidence of such a find. Yet if it occurred, and was post-war deaths, it would be the biggest single find of bodies for the whole war. We judged this log too unreliable for inclusion in the analysis.
- (IRQ20050726n134) This log mistakenly codes 20 deaths while the accompanying text makes clear that there were 8-10 deaths. This is an example of a recurring error in the SIGACT data, where some deaths and injuries described in the text are doubled in the formal columns. In this instance 10 deaths are doubled to 20.
This leaves two logs of 20+ events missing from the IBC database with a total of 45 new deaths. We get 56 new deaths if we add the two incidents above for which the number of deaths are incorrect in the logs.
Incident Details in the 'Host Nation' category
| 1 | 2-3 | 4-9 | 10-19 | 20+ | All | |
|---|---|---|---|---|---|---|
| Total logs / incidents | 6,392 | 1,841 | 627 | 84 | 14 | 8,958 |
| Sampled logs | 25 | 25 | 25 | 25 | 14 | 114 |
| Percent matched or not compatible | 60% | 70% | 92% | 96% | 100% | 64.7% |
| Estimated matching (plus non-compatible) variance | 0.25 | 0.19 | 0.077 | 0.019 | NA | 0.00080 |
| Weights | 0.71 | 0.21 | 0.070 | 0.0094 | NA | NA |
| Estimated new IBC-compatible incidents (95% CI) | 2,557 (1,252-3,862) | 552 (227-878) | 50 (2-121) | 3 (1-8) | 0 | 3,162 (2,656-3,669) |
Incident details in the 'Enemy' category
| 1 | 2-3 | 4-9 | 10-19 | 20+ | All | |
|---|---|---|---|---|---|---|
| Total logs / incidents | 5,457 | 2,602 | 1,044 | 207 | 107 | 9,417 |
| Sampled logs | 25 | 25 | 25 | 25 | 107 | 207 |
| Percent matched / Classification disputed | 32% | 20% | 10% | 26% | 28% | 26% |
| Estimated matching variance | 0.21 | 0.15 | 0.083 | 0.19 | NA | 0.00065 |
| Weights | 0.59 | 0.28 | 0.11 | 0.022 | NA | NA |
| Estimated incident classifications disputed (95% CI) | 1,746 (736-2,757) | 520 (115-926) | 104 (2-227) | 54 (17-91) | 30 | 2,454 (1,979-2,929) |
| Estimated incident classifications not disputed (95% CI) | 3,711 (2,700-4,721) | 2,082 (1,676-2,487) | 940 (817-1,063) | 153 (116-190) | 77 | 6,963 (6,488-7,437) |
Limitations/Weaknesses:
Limitations and weaknesses of our sample-based analysis include the following:
1. Formal columns in the Iraq War Logs are sometimes inaccurate. Examples include occasional transposition of deaths and injuries and double counting of some deaths/incidents in multiple logs. However, we do not think that such errors are numerous enough to strongly affect our analysis, in part because we managed to correct for some more severe instances, as indicated above.
2. A problem with the sampling is that there is some overlap between the different sampling categories. This means, for example, that an event containing both 'Civilian' and 'Host Nation' deaths is more likely to turn up in our sample then an event with only one or the other type of death. If events with deaths in multiple categories differ systematically from events with deaths in only one category then our estimates are biased. In principle, we can eliminate this bias by using a sufficiently sophisticated weighting scheme. This bias should, however, be fairly small since most events contain only one type of death.
3. The estimation method assumes that the matching rate within any size range of events applies uniformly across that whole size range even though we know that matching rates actually vary with size. This weakness was inevitable because we could not process a big enough sample to yield good estimates for every possible event size. Fortunately, this problem does not apply to the size-1 category which already accounts for more than half of the estimated civilians to be added to IBC. Moreover, it only applies slightly to the 2-3 category which provides more than a third of the civilian estimate. For events killing more than 10 almost all events match so, again, this issue rarely arises. Therefore the potential impact of this limitation is small, and largely confined to the 4-9 category.
Finally, note that all limitations of the present estimates are temporary because eventually IBC will process all the logs and learn the exact numbers.