
Every year since we began our work in 2003 IBC has published a report summarising the main features and trends of the civilian death toll in Iraq over the previous 12 months, drawing on our systematic accumulation and analysis of civilian casualties as reported by Iraqi and international news media, NGOs and official sources.
The numbers reproduced below are derived directly from our database and may change as new data is obtained, analysed and included.
Another year of relentless violence in Iraq
IBC’s 2016 analysis of civilian deaths
1. 2016 Summary and comparison to preceding years
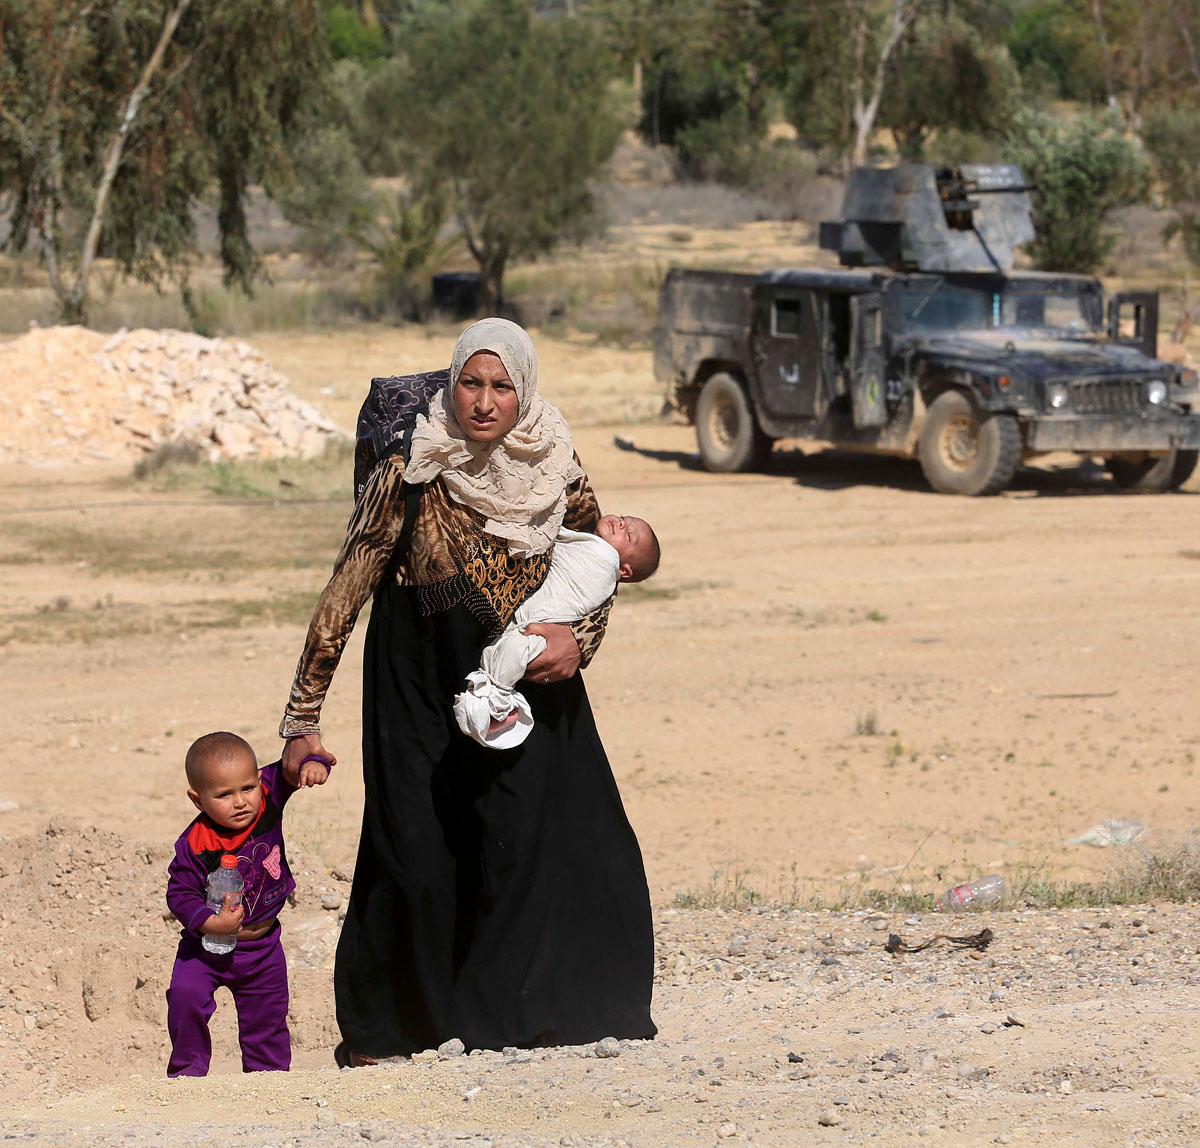
2016 has seen deadly violence continue to impact Iraqi civilians on a daily basis. This has been most significant this year in the northern city of Mosul and surrounding areas in Ninewa province under the control of Islamic State (IS), where it has carried out thousands of killings and executions. At the same time, the region has been under almost constant bombardment by US-Coalition and Iraqi government forces seeking to oust IS. Baghdad and its surroundings, even while not an area of direct conflict between IS and government forces, has witnessed daily attacks by roadside bombs, shootings and executions, as well as occasional mass casualty bombings. Civilians in Iraq, whether in contested war zones or not, have continued to lose their lives at levels similar to those that have characterised Iraq since mid-2013.
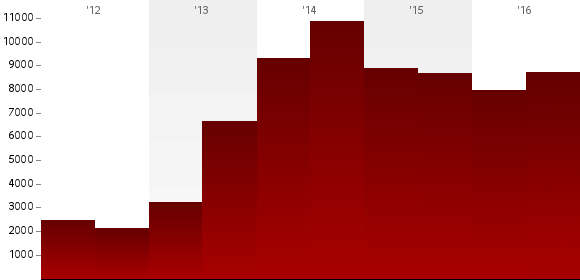
The annual total for civilian deaths in Iraq in 2016 was 16,393, which is within a broad range encompassing 2015 (17,578) and 2014 (20,218). These past three years are very much higher than the years 2010-2012, the least violent period since the invasion, when the annual numbers ranged from 4,167 to 4,622, and are also substantially higher than 2013 (9,852) which saw the beginning of the change from the pre-2013 levels to current levels. 1
1These figures are taken from the higher number in IBC’s range. Both this and the lower figure tend to be exceeded over time.
2"Reductions" in this context an abstract concept, as deaths are cumulative and their number can only increase. Reported reductions are to the rate at which deaths accumulated in a given place and period. Every life lost represents an increase in their absolute number.
An average of more than 1,300 civilians were killed in violence every month, the main exception being the September low of (935) which was however immediately followed by a peak of more than double that in October (1,970).
As the bar chart below visually illustrates, the 2016 total falls somewhat below the most recent peak in violent deaths in 2014, but remains far above the annual totals which preceded that peak, with the last 3 months (Oct-Dec 2016, as shown in Table 1) having been the worst quarter of the year.
Reductions in levels of violence during 2016 were very unequally distributed across the country, and were countered by sharp increases elsewhere, with Mosul in particular (and its surroundings) experiencing the worst levels ever recorded there (see section 2.4 below). 2
2. The civilians killed
As in other post-2003 years, information that was present for virtually all civilians reported killed in 2016 is the location in which they were killed or their bodies were found. This also holds true for the means by which they were killed, under five broad cause of death categories: executions; air attacks and shelling; suicide attacks; other improvised explosive devices (IEDs); 3 and gunfire not involving execution. Perpetrators, by contrast, were unknown for about one in every four civilians killed in 2016. Along with information on the time, location, cause of death and perpetrators, IBC collects demographic information on the victims themselves, including such identifying information as is available. 4
3 Non-suicide IEDs are ground-based bomb attacks such as e.g. roadside and remotely-triggerd or magnetic car bombs (etc.)
4 IBC's Methods pages lists other data variables collected.
5Lest we forget (30 Dec 2016) and Iraq Digital Memorial (Announcement and Facebook page).
Any serious public documentation of civilians killed will aim to record them as named individuals, as part of a record that establishes who was killed, not just how many. A recently-published companion piece to this report lists by name a sample of the individual victims in 2016 for whom further personal information has been made public, including in some cases photographs. This reflects our long-term goal to more fully humanise the victims of the war, through the forthcoming Iraq Digital Memorial project. IBC's identified victims list now spans more than 500 pages listing 25 individuals each, fewer than 10% of the deaths IBC has recorded.5
It compounds Iraq's tragic situation that detailed demographic (and particularly individualising) information is only available for so few of the victims whose deaths are reported. Information on the age and gender of victims, and how and by whom they were killed, can be of particular value in identifying the specific patterns of harm targeting these demographics. This makes it all the more important that what information is available is collected and analysed to the extent possible, even if some analyses are necessarily limited to a subset of victims.
2.1 Victim demographics
16,393 deaths were recorded for 2016, and among these victims 6,539 could be identified as men, women, or children (defined as aged 17 and below). Of this number,
- 5,008 (77%) were men;
- 729 (11%) were women;
- and 802 (12%) were children.
The demographic presence among civilian deaths of roughly 80% men, and 10% each of women and children, for deaths from all causes and perpetrators, has been fairly typical of the conflict since 2003. (Comparable figures for 2014 and 2015 are presented in Table 2.) These proportions do not hold across different weapons and perpetrators, however, as we show in sections 2.2.1 and 2.3.1 below.
| Victim records | identified as men, women, children | of whom men |
of whom women | of whom children | |
|---|---|---|---|---|---|
| 2014 | 20,218 | 9,797 (48% ) | 7,977 (81%) | 1,003 (10%) | 817 ( 8%) |
| 2015 | 17,578 | 7,740 (44% ) | 6,062 (78%) | 934 (12%) | 744 (10%) |
| 2016 | 16,393 | 6,539 (40%) | 5,008 (77%) | 729 (11%) | 802 (12%) |
2.2 How civilians were killed in 2016
6Air attacks and shelling (and other explosives that impact from the air, including artillery and mortar fire) are included in a single category because it is often difficult for witnesses on the ground to distinguish between them.
7IBC uses the term “involved” or "involving" because weapons from the different categories are sometimes used together. Thus the victim totals for these weapons categories should not be summed as this would almost never overlap.
Death by execution continues to account for by far the largest number of civilians killed in 2016 (7,238 killed, including victims of all ages) as it did in both 2014 and 2015.
Deaths from air attacks and shelling also remained at a high level through 2016, as in the preceding 2 years, accounting for 2,732 deaths, and also killing children as well as men and women.6
2.2.1 Victim demographics and cause of death
Of the 16,393 victims recorded killed in 2016, information on the weapons involved in their death (cause of death) was available for more than 99%.7 Victims who could also be demographically identified as men, women or children numbered 6,539 (40%) (see Table 2). Of these 6,539
- Executions accounted for by far the greatest number of male adults killed (3,311, 66%), with non-execution gunfire the next most frequent cause of death (790, or 16%).
- Female adults were, like male adults, killed most often by execution (221 , 30%) but also in more significant proportions by other weapons including air attacks/shelling, which accounted for 206 (28%) of women reported killed.
- Air attacks and shelling accounted for the highest number of deaths among children, killing 342 (43%) of the 802 children recorded killed. The second highest cause of death among children was executions, by which means 210 ( 26%) were put to death.
Execution was by far the largest cause of death among civilians of known age and gender, as it was for all recorded civilian killings in 2016 (and the favoured means of killing by Islamic State, the year's major perpetrator, see sections 2.3 and 2.3.1 below.) Men were the principal targets of execution, women and children less often so. However it is shocking that children, in particular, should be subject to killing by execution at all.
| All causes of death | Execution | Gunfire (non-execution) | Air attacks and shelling | IEDs (non-suicide) | Suicide bombing | |
|---|---|---|---|---|---|---|
Men |
3,919 | 3,311 (66%) | 790 (16%) | 209 ( 4%) | 443 ( 9%) | 299 ( 6%) |
| Women | 509 | 221 (30% ) | 136 (19%) | 206 (28%) | 98 (13% ) | 51 ( 7%) |
| Children | 709 | 210 (26%) | 67 ( 8%) | 342 (43%) | 132 (16%) | 73 ( 9%) |
2.3 Who killed them
8As with weapons categories, the term “involved” is used here because deaths cannot always be attributed to a single perpetrator group in incidents involving multiple armed actors. Thus these death totals by different actors cannot be straightforwardly added due to the existence of overlaps in these categories.
The perpetrators involved in killing the greatest number of civilians (9,346) in 2016 were Islamic State (IS) and those fighting them – US-led Coalition forces, the Iraqi Government and allied militias. The means of causing death which claimed the most lives across all demographics were also those most frequently used by these forces: executions in the case of IS, and air attacks/shelling by US/Coalition and Iraqi Government and allied forces. 8
The only perpetrator for whom an absolute increase in its civilian death toll was reported between 2015 and 2016 was the US/Coalition (up from 1,466 in 2015 to 1,837 in 2016). The other groups showed a reported decrease (slight in the case of IS), but note that in 2016 as in previous years, deaths with unknown perpetrators constituted a significant proportion of the total.
IBC's perpetrator information is less complete than on cause of death: in 2016, of 16,393 recorded deaths, 4,454 were by unknown perpetrators (in 2015 the equivalent number was 5,563 of 17,578 and in 2014, 9,596 of 20,218). It should not be assumed that the perpetrator breakdowns within the unknown and the known cases are similar, as some perpetrator groups may be much less likely to be identified than others. And even where a perpetrator was able to be recorded, in some incidents others might have been involved who escaped notice.
2.3.1 Victim demographics by major perpetrators
Of the victims recorded in 2016 who could be demographically identified as men, women or children, perpetrator information was available for 78% of the men, 70% of the women, and 88% of the children. As with the demographically undifferentiated numbers for 2016, one should note that this leaves a remainder involving unknown perpetrators which is highest, at nearly a third, for women, but little over 10% for children.
- Of the 3,919 deaths of adult males with known perpetrator, the vast majority involved Islamic State (3,446 , 88%). The next highest, but much lower figures were for US/Coalition (108 , 3%) and Iraqi Government and allied forces (112 , 3%).
- Of the 509 deaths of adult females whose perpetrators were known, the principal group involved was, as for men, Islamic State, who killed 319 (63%), with these figures (but unlike for men, more closely) by deaths involving US/Coalition forces (135, 27%).
- Of the 709 child killings where perpetrator was known, the largest perpetrator group involved was once again Islamic State, accounting for 412, or 58% of child deaths, with US/Coalition forces (203, or 29%) and Iraqi government and allied forces, who were involved in 104 (15%) of child deaths.
All three demographic groups fell victim to Islamic State by far the most often. It is however notable that the US/Coalition caused a significant proportion of women and children reported killed.
| Men, women, and child deaths by major perpetrators | whose perpetrator was known | Islamic State | US/Coalition | Iraqi Gov and allied forces |
|---|---|---|---|---|
| Men | 3,919 | 3,446 (88%) | 108 ( 3%) | 112 ( 3%) |
| Women | 509 | 319 (63%) | 135 (27%) | 61 (12%) |
| Children | 709 | 412 (58%) | 203 (29%) | 104 (15%) |
2.4 Where civilians were killed in 2016
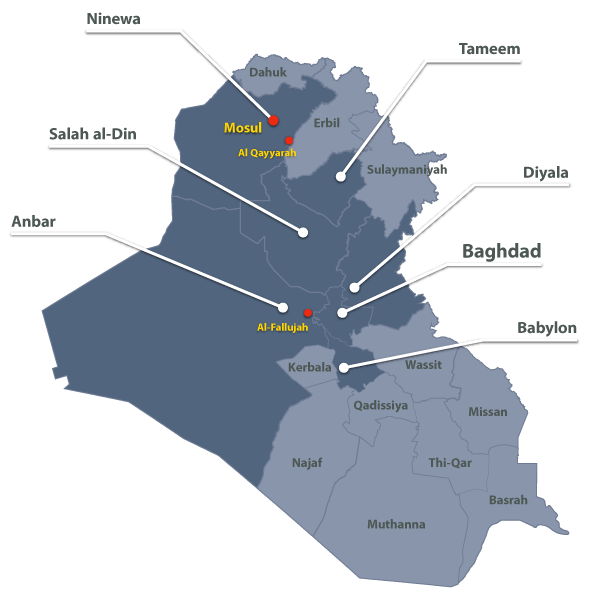
Figure 2 above shows the 7 Iraqi provinces (also called governorates) with the highest civilian death tolls in 2016, accounting between them for the vast majority of recorded deaths. These include areas held by IS, as well as the so-called ”Baghdad Belts” where the capital shares borders with Anbar, Salah al-Din, Diyala and Babylon, all of which led to the concentration of civilian casualties in these provinces. 9
9 Province boundaries vary across commonly used maps of Iraq, particularly for Baghdad province, which is often depicted as smaller than in Figure 2. IBC codes for both sets of boundaries and where necessary IBC province figures split the difference between these two versions in assigning deaths to bordering provinces.
Three cities with significant death toll changes between 2014, 2015, and 2016 were Fallujah, Mosul and Al-Qayyarah. Fallujah had a noticeable decline, particularly in the last half of 2016. Al-Qayyarah as well witnessed a decline in the last four months of 2016, despite being the year’s third highest city in number of civilian deaths Iraq (overtaking Fallujah). In contrast Mosul casualties have dramatically increased over the full period, with the highest monthly Mosul death toll of the entire post-invasion period being in November 2016 (1,059 in one month alone, which is significantly more than the monthly death toll for the entire country prior to June 2013).
3. Large-scale incidents in 2016 and earlier
2016 also witnessed some particularly shocking events, even by post-invasion standards. An example of that is the most deadly ground-based bombing attack in Baghdad, which was claimed by IS and hit a very crowded market in the central area of Karrada, on the 3rd of July just one day before Muslims’ Eid al-Fitr, killing 324, including women, children and members of entire families, according to the latest reports.
The second largest deadly bombing of 2016 took place in Shomali village, southeast of Hilla, on the 24th of November. The suicide attack was carried out using a fuel tanker and targeted buses carrying Muslim pilgrims returning from the religious rituals of Imam Hussein Arba'een in Karbala. The powerful explosion took the lives of up to 100 civilians, with casualties not limited to Iraqis but including nationals from Iran, Afghanistan and Pakistan.
Another brutal attack shocked the world in 2016 on the 25th of March, when an IS child recruit detonated his suicide belt in the midst of a trophy award ceremony in Alexandria district, north of Hilla, killing 17 children, some as young as ten years old.
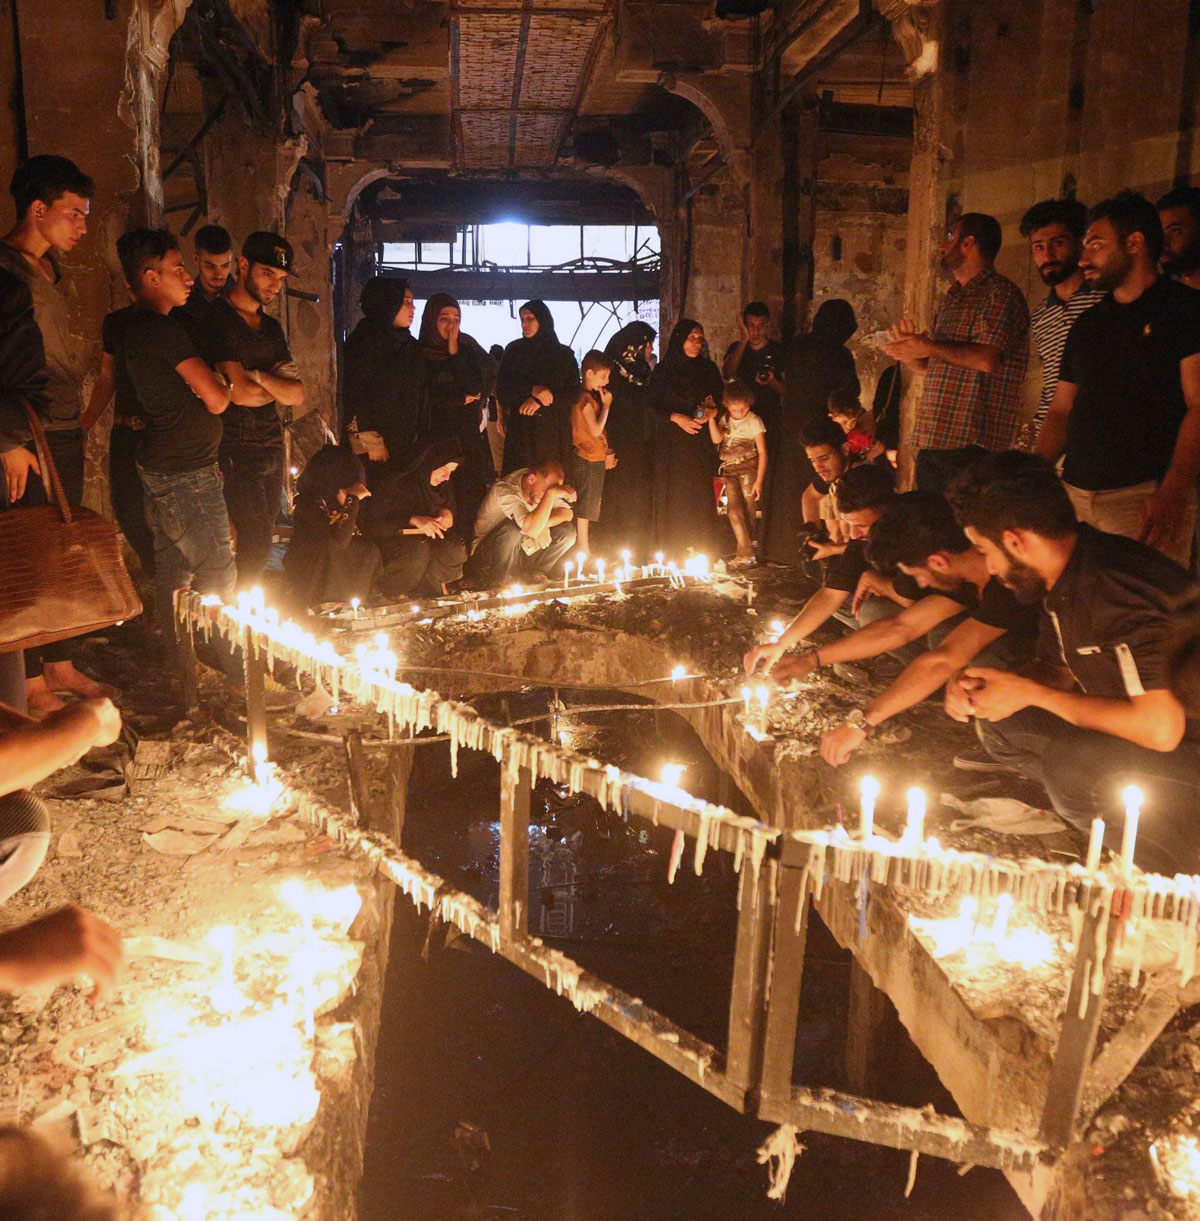
People light candles inside a mall at the scene of a massive truck bomb attack in Karada neighborhood, Baghdad, Iraq, Tuesday, July 5, 2016. Iraqis mourn for their dead and prepare for the Muslim holiday of Eid al-Fitr under the pall of one the worst bombings in 13 years of war. An Islamic State suicide bomber struck Baghdad's bustling commercial area of Karada on Sunday night, after people came out after breaking their daily fast. (AP Photo/Hadi Mizban)
All deadly attacks are devastating to those affected by them, no matter their scale. However for reference, the table below shows IBC’s list of all 19 suicide or IED attacks that killed 100 or more civilians in Iraq, from 2003-2016. A list for the same period that included attacks killing 50 or more would contain 97 entries (or 312 entries for those killing 25 or more, and 1,028 entries involving 10 or more deaths).
| IBC page | Date | Incident summary |
|---|---|---|
| k021 | 1 February 2004 | 107-109 by suicide bombers in party offices in Irbil |
| k022 | 2 March 2004 | 121 by suicide bombers in Karbala |
| k991 | 28 February 2005 | 125-136 by suicide car bomb in Hilla |
| k1100 | 29 August 2003 | 83-126 by car bombs at Imam Ali mosque, Najaf |
| k1903 | 14 September 2005 | 111-114 by suicide bomb, Kadhimiya, Baghdad |
| k1981 | 29 September 2005 | 99-102 by car bombs in Balad |
| k4710 | 23 November 2006 | 215 by bombs, mortars in Sadr City, Baghdad |
| k5356 | 3 February 2007 | 136-137 by suicide truck bomb in market, Sadriya, Baghdad |
| k5659 | 6 March 2007 | 118-120 Shiite pilgrims by suicide bombers in Hilla |
| k5897 | 27 March 2007 | 152 by truck bombs in market, Tal Afar |
| k6112 | 18 April 2007 | 140 by car bomb, Sadriya food market, Baghdad |
| k6891 | 7 July 2007 | 159-160 by suicide truck bomb in market, Amerli, near Tuz Khurmato |
| k7225 | 14 August 2007 | 516-525 by suicide fuel tanker bombs in Yazidi villages, Sinjar area |
| k13866 | 19 August 2009 | 130-132 in multiple bombings in Baghdad |
| k14203 | 25 October 2009 | 150-152 in suicide truck bombings, Haifa Street, central Baghdad |
| k14379 | 8 December 2009 | 122-127 in 5 car bombings in Baghdad |
| k21122 | 17 July 2015 | 95-120 by suicide car or truck bomb in Khan Bani Saad |
| d12134 | 3 July 2016 | 323-371 by suicide truck bomb in Karradah district, central Baghdad |
| d12819 | 24 November 2016 | 80-100 by suicide truck bomb near Hilla |
4. Civilians injured
IBC does not record incidents causing injuries and no deaths, but does record the injuries, which are serious, that occur in incidents that also cause deaths. These data are systematically recorded but not individually published on the IBC website, but it is useful to analyse and understand the types of weapons and attacks that cause injuries as well as deaths.
10 For an earlier IBC analysis on the civilian wounded resulting immediately from the 2003 “Shock and Awe’” phase of the 2003 invasion, see Adding Indifference to Injury and over a longer period, see A Dossier of Civilian Casualties in Iraq 2003-2005
In 2016 (as in 2014 and 15), there were roughly the same number of civilians recorded injured as killed. However the proportion of killed to injured is highly dependent on the nature of the weapons. Our analysis shows that the great majority of injuries were associated with explosive weapons, broadly covering the weapon categories of ground bombing, air attacks and shelling, and suicide attacks: 17,806 of the total number of 18,087 were injured by weapons in these categories. This pattern holds true for the preceding three years, as indeed it has throughout the conflict, a pattern which tends to underscore the intrinsically indiscriminate nature of explosive weapons, as has been shown in many other contexts.10
5. Combatants and total deaths since 2003
Civilians, tragic as their deaths are, are not the only casualties of this war. In 2016, clashes between Iraqi military and allied militias on the one part, and insurgent groups such as IS on the other, have continued to cause thousands of deaths among these groups, particularly in Mosul and areas of Anbar.
11 For a more detailed discussion of these issues see section 4 of IBC's 2014 report
12Also see the earlier IBC announcement of this table, where the use of the Iraq War Logs and other sources is described.
Reporting on combatant casualties is often more questionable and far harder to verify than civilians, particularly since the emergence of IS in 2014.11 But even under the most conservative reading, the available data show that tens of thousands of fighters need to be added to the civilian death toll to begin to assess the full human cost of this ongoing conflict.12
| Iraq Body Count March 2003-December 2016 | 188,771 |
|---|---|
| Insurgents, Iraqi soldiers & other combatants killed 2010–2016 | 32,340 |
| Iraq War Logs new 'Civilian' and comparable 'Host Nation' remaining 2004-2009 - central estimate (9420), ‘Host Nation’ combatant 2004-2009 - central estimate (5575), ‘Enemy’ (minus IBC overlaps) 2004-2009 - central estimate (20499) | 35,494 |
| Iraqi combatants killed March-May 2003 (4,895); Insurgents killed June-December 2003 (597); Insurgents killed May 2004 (652); Insurgents & Iraqi soldiers killed March 2009 (59) | 6,203 |
| TOTAL IRAQI DEATHS | 262,808 |
| US & Coalition military killed 2003–2016 | 4,832 |
| US & Coalition foreign contractors killed 2003–2016 | 468 |
| TOTAL DEATHS | 268,108 |
6. Other sources
IBC is not the only organisation issuing casualty totals for Iraq. The United Nations in Iraq (UNAMI) issues monthly casualty totals, and their published civilian death toll for 2016 is 6,876. Such official figures have typically been lower than the figures provided by IBC, often vastly lower, as in 2016.
As we have remarked in earlier reports, when comparing differing published figures for Iraq it is important to note that on its public database IBC openly lists the violent incidents from which it derives its data, along with the original publishing sources for each entry. Progress in understanding differences between IBC and others requires looking beyond “competing totals” and examining what lies beneath them: that is, identifying which specific incidents are included in each total.
Until agencies such as UNAMI also make available the underlying data for their totals in the same disaggregated, incident-by-incident fashion that IBC does, it will remain impossible for third parties to meaningfully investigate and understand these differences (which is one reason why we and others have repeatedly called for such open publication by official sources. IBC has committed itself to abiding by recently launched international Standards for Casualty Recording which prescribe maximum possible detail and transparency in pursuit of the “ultimate objective of the recognition of every casualty” (Standard 53).
Such recognition can only be achieved where the individual incidents contained within larger totals are each published, together with whatever information is available about the people killed in them. It is this recognition which has always motivated our work, and which guides the future development of it. We are heartened that this goal is shared by increasing numbers of others, including the NGO airwars.org whose data on victims of coalition strikes, fully incorporated into our database, has greatly enriched detailed knowledge of victim identity and the incidents in which they were killed.